

 |
Friday, August 10, 2007
Food Price Map
By Sandy Chase
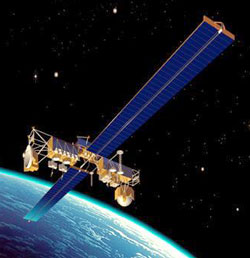
NASA satellites are now watching crops grow on earth. It turns out that monitoring farms from space is a good way to see if food crops are in trouble. As this ScienCentral News video explains, spotting trouble early may have an impact on what you pay for food.
Food Forecasting
While farmers have their eyes on the ground when it comes to their farms, scientists know that an eye in the sky may provide a better idea of how good a harvest will be, and how much consumers will end up paying in the market.
"The satellite remote sensing information is really the best way to find out the locations where food production might be lower than we expected," says Molly Brown, a senior research scientist at NASA's Goddard Space Flight Center. "So if it's a corn crop, for example, if it was very dry that year, the corn would be very small and brown and produce very little grain."
Brown and her colleagues have added a new wrinkle. They factor in climate and vegetation observations from space and local market information to create a map of predicted prices.
Creating the Maps
Brown's maps start at NOAA, The National Oceanic and Atmospheric Administration, which creates the Normalized Difference Vegetation Index (NDVI ). That gives a green and brown picture of current vegetation conditions. She and her colleagues add rainfall measurements-- "If it rains today it will be green tomorrow" --and look at humidity and sea surface temperatures to create a vegetation forecast for the next one to four months.
Based on those predictions and information about local markets across the region, Brown formulates a continuous map of market price forecasts.
Their first maps, which will appear in the journal Land Economics, are of the dry central and northern regions of West Africa, where food prices are a matter of basic survival.
"Because in this region, it rains only for four months or so," says Brown. "So, this humidity/rainfall information is then put together in a model and allows us to predict how green it's going to be two, three, four months into the future."
Food Security
That prediction is important not just for food production, but also for food access -- whether people in the region can afford to buy food for their families. Brown combines these two factors to measure overall food security. When food security is critically low, it's time for international aid agencies to step in and help. When it's high, markets should be stable and people will have access to the food they need to survive.
Brown says the Africa food price map will be available in 2008, with vegetation maps for other parts of the world in 2010. When are we going to see a map of prices at our local grocery store? Well, it's not that simple in a country as mobile as the U.S., Brown explains.
Local Conditions
"So, in the U.S., it's completely different: we eat lettuce from California and we eat, you know, strawberries from Guatemala, and so because of the internationalization, the globalization of our market system, it's very hard to determine the impact of food production on local prices" she says.
"In Africa, in these very small, informal markets, almost all of the grain that's bought and sold there is grown locally and is moved into the markets on foot."
But U.S. farmers will still benefit from Brown's work. The maps that she and her colleagues plan to develop for the U.S. will predict vegetation and rainfall levels months in advance, helping farmers decide what crops to plant when.
This research will be published in the journal Land Economics in Spring 2008, and was funded by NASA, USAID, and the USDA.
ScienCentral News
© 2000-2007 ScienCentral
By Sandy Chase
NASA satellites are now watching crops grow on earth. It turns out that monitoring farms from space is a good way to see if food crops are in trouble. As this ScienCentral News video explains, spotting trouble early may have an impact on what you pay for food.
Food Forecasting
While farmers have their eyes on the ground when it comes to their farms, scientists know that an eye in the sky may provide a better idea of how good a harvest will be, and how much consumers will end up paying in the market.
"The satellite remote sensing information is really the best way to find out the locations where food production might be lower than we expected," says Molly Brown, a senior research scientist at NASA's Goddard Space Flight Center. "So if it's a corn crop, for example, if it was very dry that year, the corn would be very small and brown and produce very little grain."
Brown and her colleagues have added a new wrinkle. They factor in climate and vegetation observations from space and local market information to create a map of predicted prices.
Creating the Maps
Brown's maps start at NOAA, The National Oceanic and Atmospheric Administration, which creates the Normalized Difference Vegetation Index (NDVI ). That gives a green and brown picture of current vegetation conditions. She and her colleagues add rainfall measurements-- "If it rains today it will be green tomorrow" --and look at humidity and sea surface temperatures to create a vegetation forecast for the next one to four months.
Based on those predictions and information about local markets across the region, Brown formulates a continuous map of market price forecasts.
Their first maps, which will appear in the journal Land Economics, are of the dry central and northern regions of West Africa, where food prices are a matter of basic survival.
"Because in this region, it rains only for four months or so," says Brown. "So, this humidity/rainfall information is then put together in a model and allows us to predict how green it's going to be two, three, four months into the future."
Food Security
That prediction is important not just for food production, but also for food access -- whether people in the region can afford to buy food for their families. Brown combines these two factors to measure overall food security. When food security is critically low, it's time for international aid agencies to step in and help. When it's high, markets should be stable and people will have access to the food they need to survive.
Brown says the Africa food price map will be available in 2008, with vegetation maps for other parts of the world in 2010. When are we going to see a map of prices at our local grocery store? Well, it's not that simple in a country as mobile as the U.S., Brown explains.
Local Conditions
"So, in the U.S., it's completely different: we eat lettuce from California and we eat, you know, strawberries from Guatemala, and so because of the internationalization, the globalization of our market system, it's very hard to determine the impact of food production on local prices" she says.
"In Africa, in these very small, informal markets, almost all of the grain that's bought and sold there is grown locally and is moved into the markets on foot."
But U.S. farmers will still benefit from Brown's work. The maps that she and her colleagues plan to develop for the U.S. will predict vegetation and rainfall levels months in advance, helping farmers decide what crops to plant when.
This research will be published in the journal Land Economics in Spring 2008, and was funded by NASA, USAID, and the USDA.
ScienCentral News
© 2000-2007 ScienCentral
# posted by J @ 4:08 PM 